Introducing the Amazon All-in-One Dashboard
The Amazon All-in-One Overview Dashboard offers a comprehensive solution to understand, evaluate, and optimize your Amazon operation across sales, marketing, and customer performance.
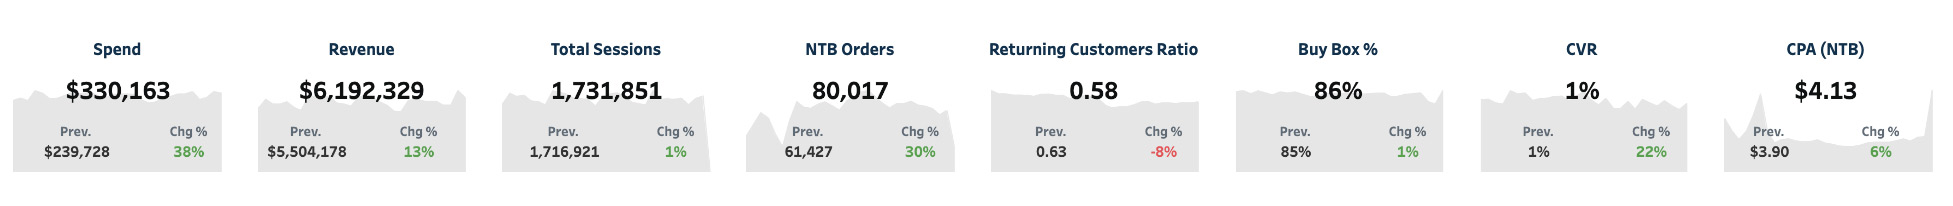
Combining Critical Sales, Customer, and Ad Metrics in One Place
- Ad Spend
- Revenue
- Total Sessions
- New-to-Brand (NTB) Orders
- Returning Customer Ratio
- Buy Box %
- CVR
- CPA (NTB)
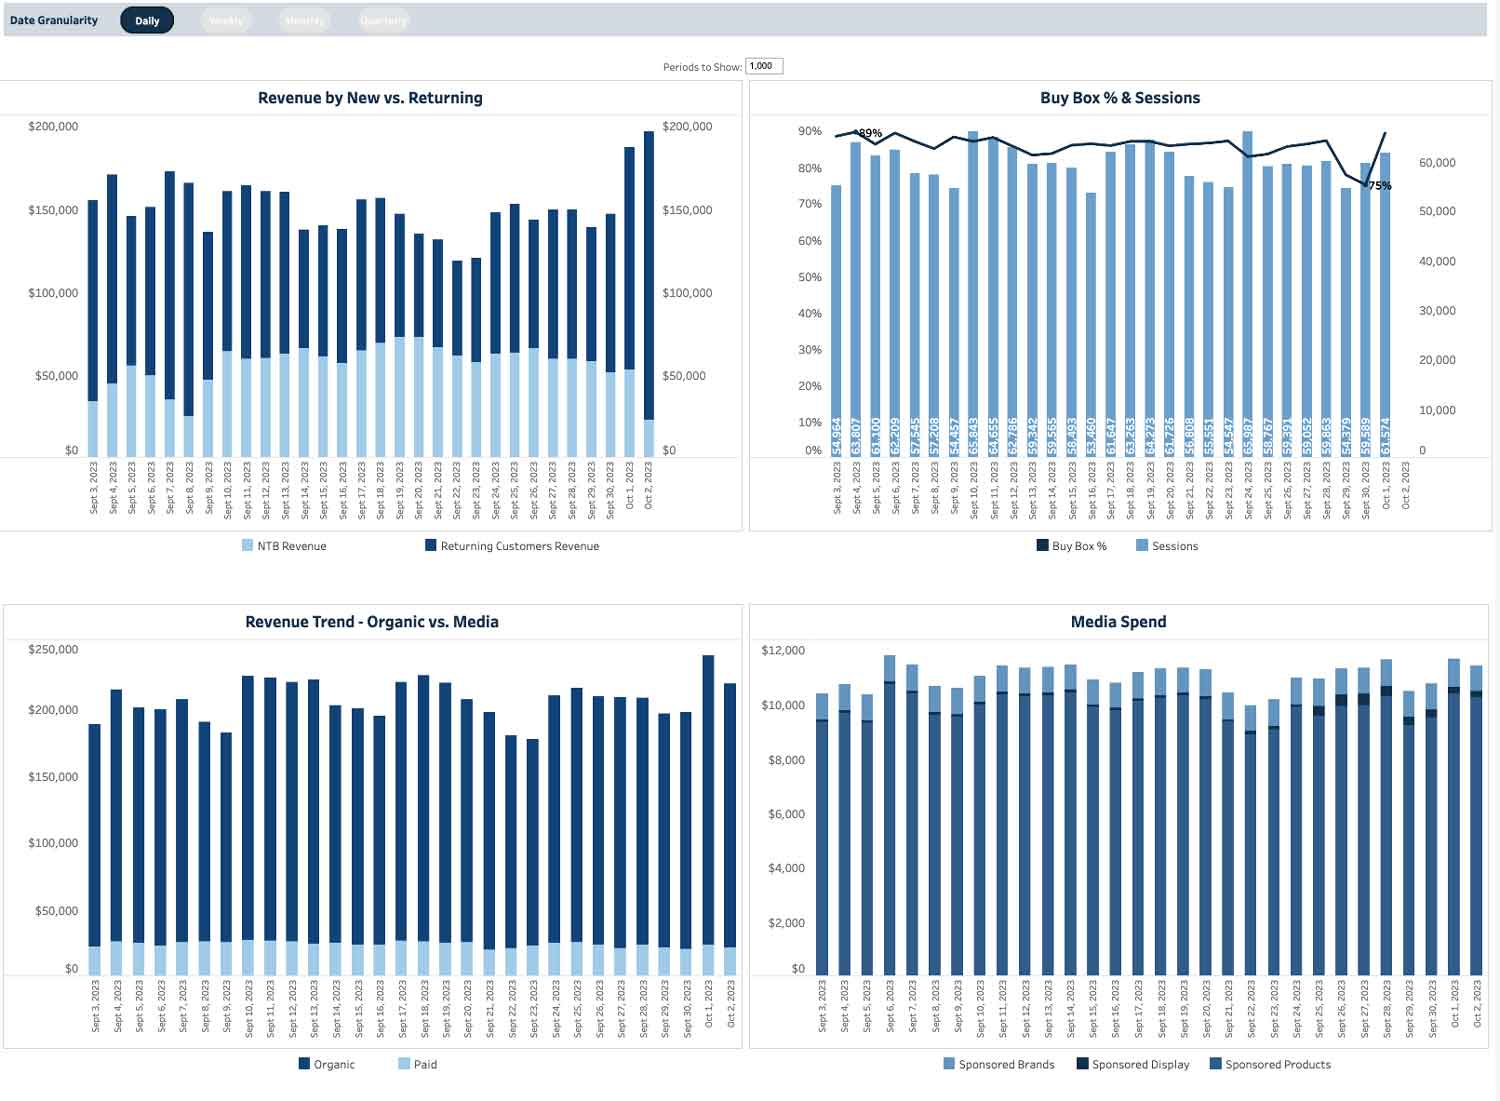
Understand NTB vs Returning Customer Purchases, Organic vs Media Revenue Trends
Many brands operate without a clear understanding of their New-to-Brand (NTB) customers—those who purchase in the last 12-months. Here, you can view how NTB growth is trending, and its relation to Revenue (organic vs media spend).
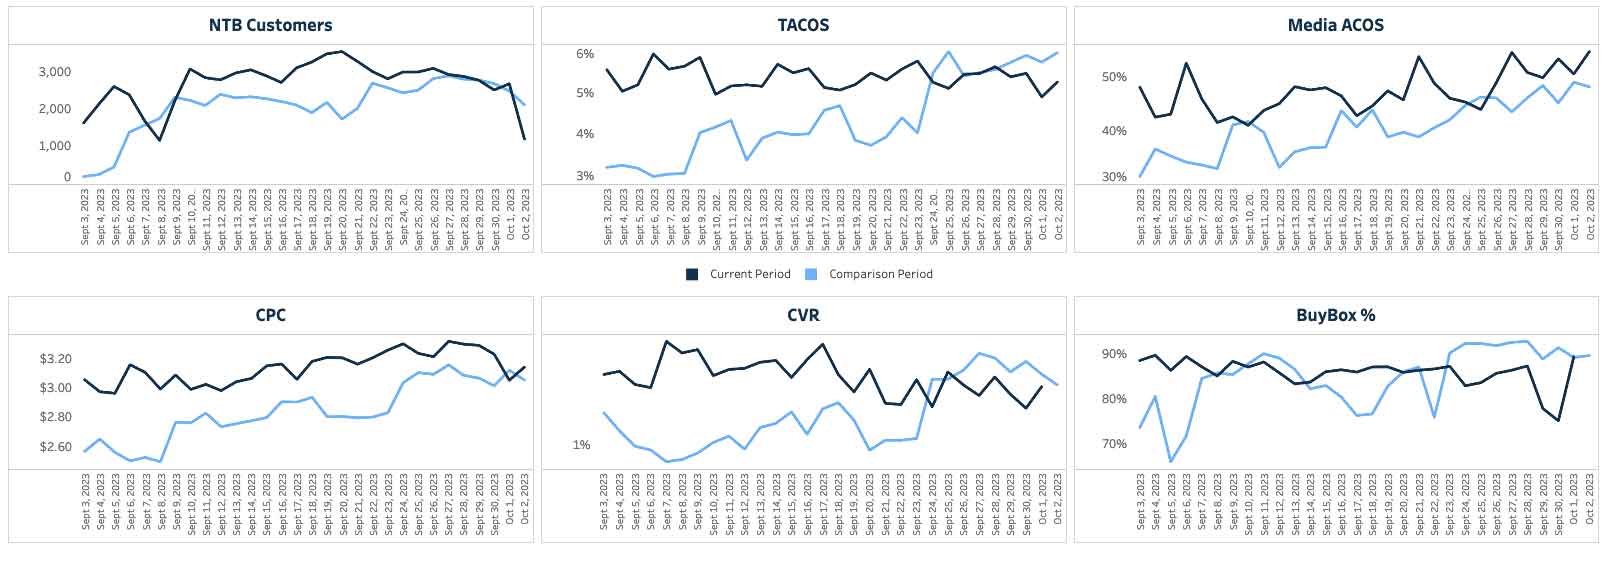
Key ad metrics, giving you a glimpse at important trends that can positive/negatively impact your business:
- NTB Growth
- TACOS (Total Advertising Cost of Sale) – % of ad spend compared to total Amazon sales from both PPC ads and organic sales
- Media ACOS (Advertising cost of Sale) – % of ad spend compared to ad sales
- Cost per acquisition (CPA)
- Conversion Rate (CVR)
- Buy Box %
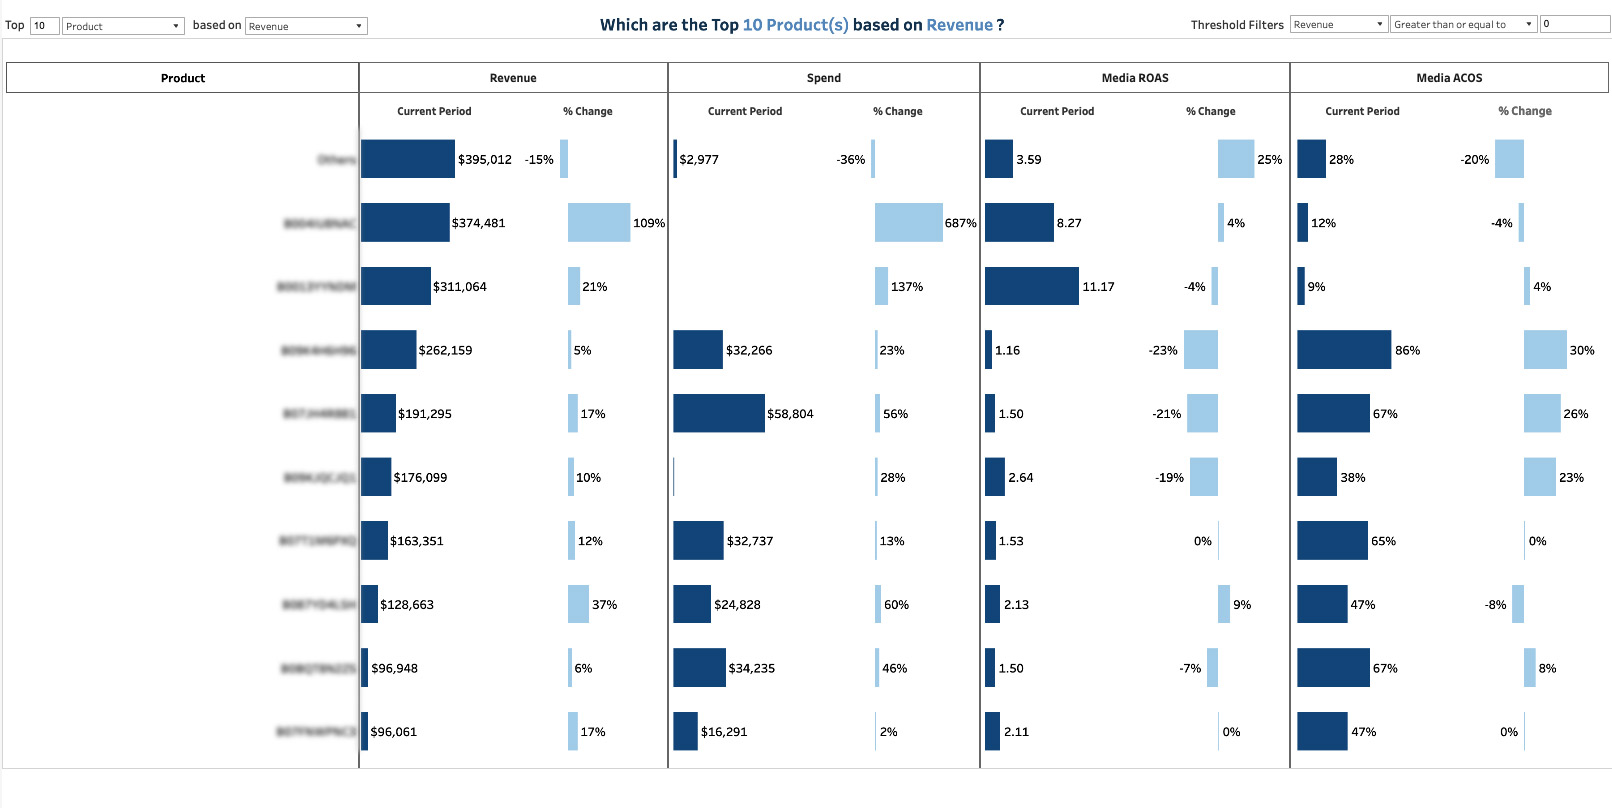
Top 10 Products Breakdown
Identifying your top-performing products is crucial for maximizing profitability on Amazon. Our dashboard provides a breakout of your top 10 products based on Revenue, allowing you to allocate resources more efficiently and focus on what truly matters. Additionally, you can analyze related spend, media Return on Ad Spend (ROAS), and Media Advertising Cost of Sales (ACOS) to ensure you’re getting the most out of your advertising budget.
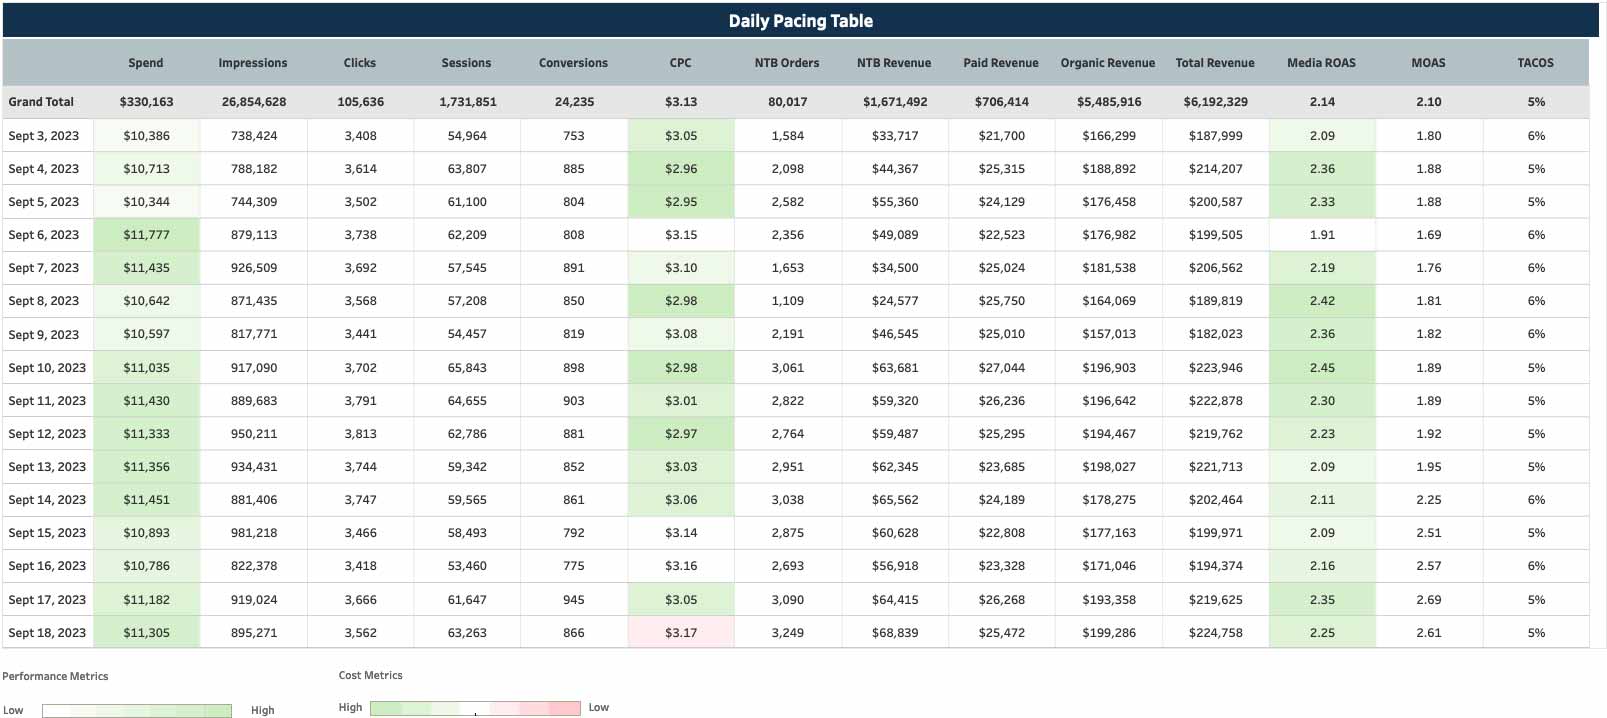
Daily Pacing Table
For individuals seeking a table format to compare all data, we provide a Daily Pacing Table that emphasizes performance and cost metrics. This allows you to assess and optimize your optimal sales and media combinations.
Conclusion: Transforming Data into Meaningful Actions
The Amazon All-in-One Overview Dashboard goes beyond mere data presentation, converting information into actionable insights. It offers a comprehensive view of sales and marketing data, facilitating a deeper understanding of how these crucial aspects of your Amazon business intersect and impact each other. NTB performance complements these and gives greater context into your overall growth. Whether you need to optimize advertising, refine your product lineup, or allocate resources more effectively, the insights from this dashboard can translate into pivotal business decisions that affect your bottom line.
Reach out to iDerive today for a chat about using deep data to drive high sales for your Amazon brand.